…
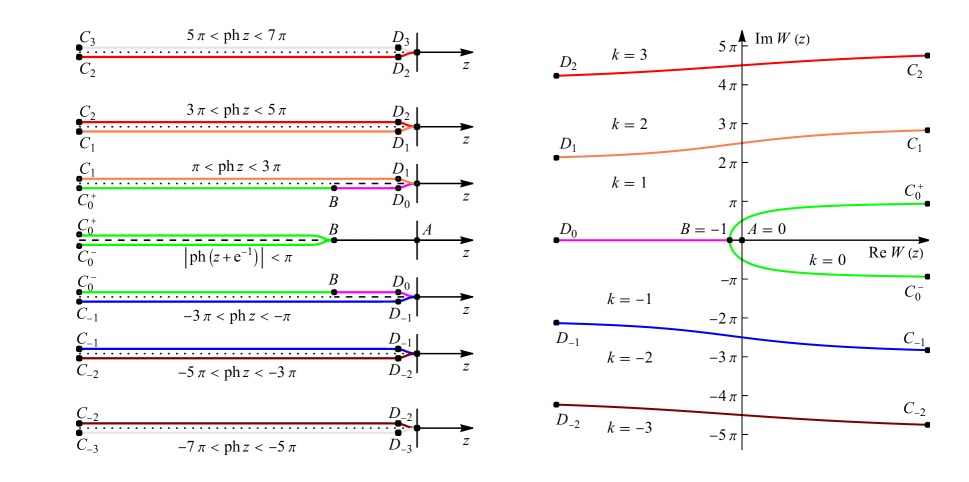
►►►Figure 4.13.2: The function on the first 5 Riemann sheets.
maps the first Riemann sheet in the middle of the left-hand side to the region enclosed by the green curve on the right-hand side; it maps the Riemann sheet on the left-hand side to the region enclosed by the pink, green and orange curves on the right-hand side, etc.
Magnify
…
►
…
►The error curve is shown in Figure 3.11.1.
…
►In computer graphics a special type of spline is used which produces a Bézier curve.
A cubic Bézier curve is defined by four points.
…A complete spline results by composing several Bézier curves.
A special applications area of Bézier curves is mathematical typography and the design of type fonts.
…
 ►
►
