visualizations
(0.000 seconds)
1—10 of 23 matching pages
1: Qiming Wang
…
►She started to work for NIST in 1990 and was on the staff of the Visualization and Usability Group in the Information Access Division of the Information Technology Laboratory in the National Institute of Standards and Technology when she retired in March, 2008.
►Web-based 3D graphics and visualization are her main research and development interests.
She has applied VRML and X3D techniques to several different fields including interactive mathematical function visualization, 3D human body modeling, and manufacturing-related modeling.
…
2: Viewing DLMF Interactive 3D Graphics
…
►Below we provide some notes and links to online material which might be helpful in viewing our visualizations, but please see our Disclaimer.
…
►Until these issues are resolved we cannot guarantee that the DLMF WebGL visualizations can be viewed in Internet Explorer.
…If you have trouble viewing the WebGL visualizations in your web browser, see x3dom.org or caniuse.com/webgl for information on WebGL browser support.
…
►Note that some VRML/X3D browsers are not capable of handling the complex files necessary for our visualizations.
…Linux users must view the visualizations in a WebGL-enabled browser.
…
3: Brian Antonishek
…
►Brian Antonishek is on the staff of the Visualization and Usability Group in the Information Access Division of the Information Technology Laboratory at the National Institute of Standards and Technology.
…
►Before coming to NIST in 1997, he developed user interaction and scientific visualization techniques for viewing and analyzing 3D engineering data.
…
4: Bonita V. Saunders
…
►She is the Visualization Editor and principal designer of graphs and visualizations for the DLMF.
…
►Her research interests include numerical grid generation, numerical solution of partial differential equations, and visualization of special functions.
…
►As the principal developer of graphics for the DLMF, she has collaborated with other NIST mathematicians, computer scientists, and student interns to produce informative graphs and dynamic interactive visualizations of elementary and higher mathematical functions over both simply and multiply connected domains.
…
5: Publications
…
►
B. V. Saunders and Q. Wang (1999)
Using Numerical Grid Generation to Facilitate 3D Visualization of
Complicated Mathematical Functions,
Technical Report NISTIR 6413 (November 1999), National Institute of Standards and Technology.

►
Q. Wang and B. V. Saunders (1999)
Interactive 3D Visualization of Mathematical Functions Using VRML,
Technical Report NISTIR 6289 (February 1999), National Institute of Standards and Technology.
…
►
B. V. Saunders and Q. Wang (2000)
From 2D to 3D: Numerical Grid Generation and the Visualization of Complex Surfaces,
Proceedings of the
7th International Conference on Numerical Grid Generation in Computational Field Simulations,
Whistler, British Columbia, Canada,
September 25-28, 2000.
…
►
B. V. Saunders and Q. Wang (2005)
Boundary/Contour Fitted Grid Generation for Effective Visualizations
in a Digital Library of Mathematical Functions,
Proceedings of the 9th International Conference on Numerical Grid Generation
in Computational Field Simulations,
San Jose, June 11–18, 2005. pp. 61–71.
►
Q. Wang and B. V. Saunders (2005)
Web-Based 3D Visualization in a Digital Library of Mathematical Functions,
Proceedings of the Web3D Symposium,
Bangor, UK, March 29–April 1, 2005.
…
6: Abdou Youssef
…
►Youssef has published numerous papers on theory and algorithms for search and retrieval, audio-visual data processing, and data error recovery.
…
7: Philip J. Davis
…
►Davis’s comments about our uninspired graphs sparked the research and design of techniques for creating interactive 3D visualizations of function surfaces, which grew in sophistication as our knowledge and the technology for developing 3D graphics on the web advanced over the years.
Today the DLMF contains close to 600 2D and 3D graphs and more than 200 interactive 3D visualizations.
…So while there are no chapters of NIST’s DLMF written by him and no chapter authors that he hired, perhaps every visualization in the DLMF should be stamped “Influenced by Philip J.
…
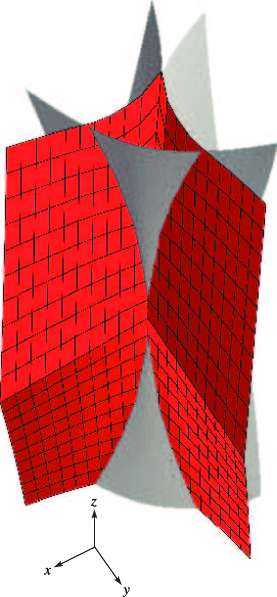
8: 36.3 Visualizations of Canonical Integrals
§36.3 Visualizations of Canonical Integrals
►§36.3(i) Canonical Integrals: Modulus
… ►§36.3(ii) Canonical Integrals: Phase
… ►9: 36.4 Bifurcation Sets
…
►