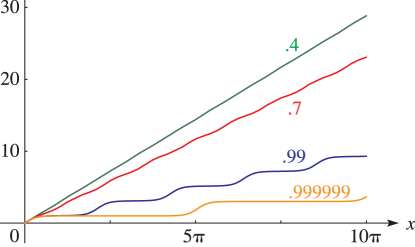
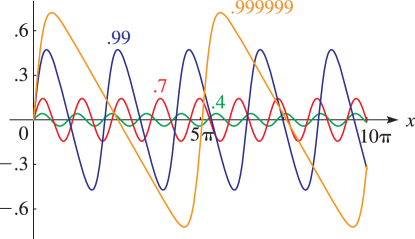
graph ♦ 21—30 of 65 matching pages ♦ SearchAdvancedHelp (0.001 seconds) 21—30 of 65 matching pages 21: 4.15 Graphics … 22: 28.3 Graphics … ► §28.3(i) Line Graphs: Mathieu Functions with Fixed q and Variable x … ►For further graphs see Jahnke et al. (1966, pp. 264–265 and 268–275). … 23: 33.15 Graphics … ► §33.15(i) Line Graphs of the Coulomb Functions f ( ϵ , ℓ ; r ) and h ( ϵ , ℓ ; r ) … 24: 14.4 Graphics … ► §14.4(i) Ferrers Functions: 2D Graphs … ► §14.4(iii) Associated Legendre Functions: 2D Graphs … 25: 29.4 Graphics … ► §29.4(i) Eigenvalues of Lamé’s Equation: Line Graphs … ► §29.4(iii) Lamé Functions: Line Graphs … 26: 15.3 Graphics … ► §15.3(i) Graphs … 27: 22.16 Related Functions … ► §22.16(iv) Graphs … ► ►► Figure 22.16.2: Jacobi’s epsilon function ℰ ( x , k ) for 0 ≤ x ≤ 10 π and k = 0.4 , 0.7 , 0.99 , 0.999999 . (These graphs are similar to those in Figure 22.16.1; compare (22.16.3), (22.16.17), and the graphs of dn ( x , k ) in §22.3(i).) Magnify ► ►► Figure 22.16.3: Jacobi’s zeta function Z ( x | k ) for 0 ≤ x ≤ 10 π and k = 0.4 , 0.7 , 0.99 , 0.999999 . Magnify 28: 4.3 Graphics … 29: 4.29 Graphics … 30: 5.3 Graphics …
 ►
►
 ►
►