14 Legendre and Related FunctionsComplex Arguments14.21 Definitions and Basic Properties14.23 Values on the Cut
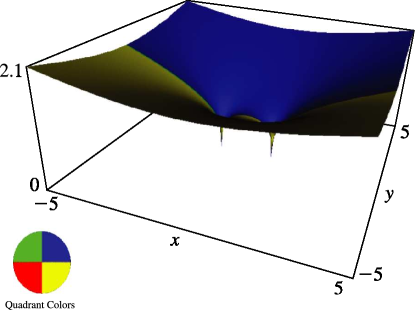
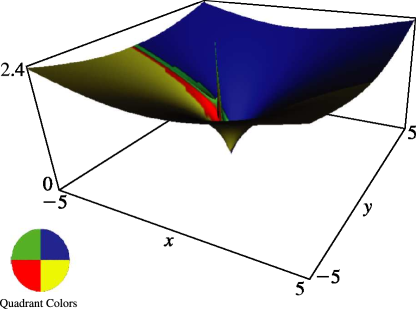
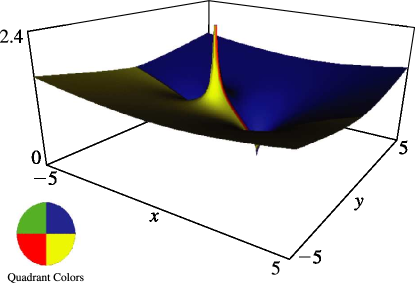
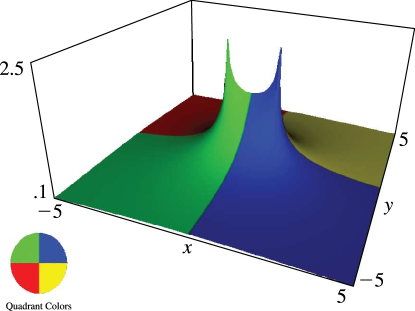
§14.22 Graphics
In the graphics shown in this section, height corresponds to the absolute value of the function and color to the phase. See also About Color Map.


