Gamma & Digamma Phase Plots
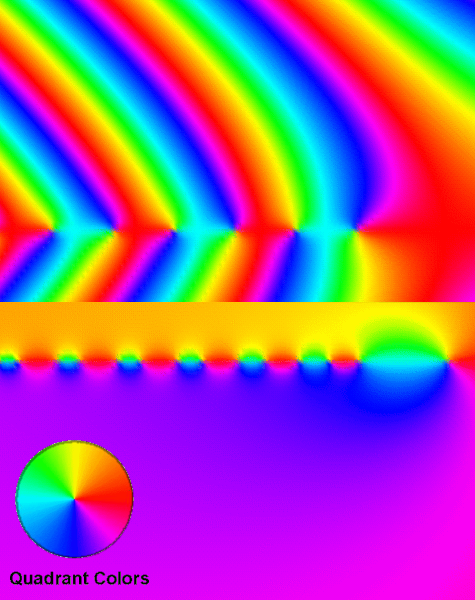
The color encoded phases of (above) and (below), are constrasted in the negative half of the complex plane.
In the upper half of the image, the poles of are clearly visible at negative integer values of : the phase changes by around each pole, showing a full revolution of the color wheel. This pattern is analogous to one that would be seen in fluid flow generated by a semi-infinite line of vortices.
In the lower half of the image, the poles of (corresponding to the poles of ) and the zeros between them are clear. Phase changes around the zeros are of opposite sign to those around the poles. The fluid flow analogy in this case involves a line of vortices of alternating sign of circulation, resulting in a near cancellation of flow far from the real axis.